Dividend Investing – Part II
This article is the second in a series highlighting Dividend Investing and its role within portfolios. The inspiration for this series is the first anniversary of the newest addition to the Alitis suite of funds: the Alitis Dividend Growth Pool. For more information or if you have follow-up questions from this article, please reach out to your Alitis adviser.
In Part I of this series, we reviewed the basics of Dividend Investing. In Part II, we look at the current market environment to provide our outlook for Dividend Investing for the years ahead.
2021 was a year full of twists and turns. Time and again, investors brushed off news that could have derailed investment markets. A contested US presidential election, an assault on the US Capitol, historically high inflation, supply chain disruptions—none of these events stopped the investment markets from achieving strong performance. Even the Delta and Omicron variants of COVID-19 failed to cast a shadow during the holiday season of 2021, and the markets closed out the year strongly.
2022 is also starting off in dramatic fashion. Russia’s invasion of Ukraine, central bank plans for raising interest rates & possible quantitative tightening, and lurking fears of the Omicron variant & its impact on supply chain issues are causing the markets to be very volatile over the last few weeks. The Bank of Canada kept its policy interest rate unchanged on January 26th, 2022. Similar to their US counterparts, the Bank of Canada left no doubts that rate hikes are coming.
While many moving parts cloud the outlook for markets, some key themes are beginning to emerge. Let’s take a closer look at a few of these major issues to develop our investment thesis.
Current Macroeconomic Environment
Rising Interest Rates
In the image below (Figure 1), the expected federal funds rate is shown to be increasing from around 0% to close to 2% over the next two years. While those numbers may not seem like extreme changes, when applied to the billions of dollars of future earnings and the billions of dollars of debt held by companies, it can make a significant difference to earnings and valuations.
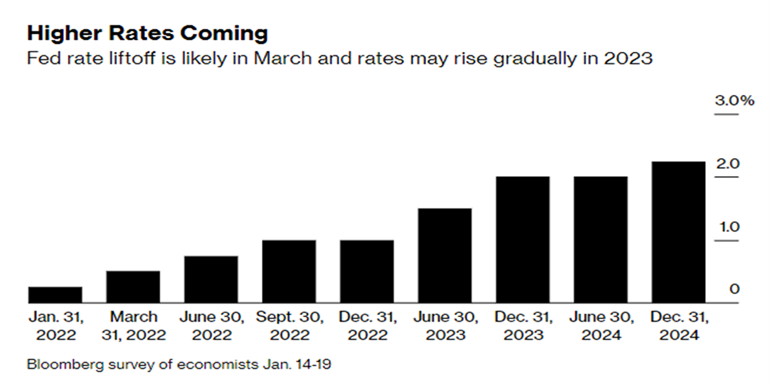 Figure 1 – Higher Rates Coming (Bloomberg)
Higher rates reduce the value of companies’ future earnings, which is an important part of discounted cash flow valuation models. This weighs especially on shares of fast-growing companies with much of their valuation reliant on profits in the years ahead.
This effect would warrant an overweight of value-oriented sectors like cyclicals, financials, and energy over expensive growth stocks like the technology sector.
Higher Inflation
Inflation numbers continue to come in red hot (Figure 2) and will continue to be a talking point for the next few years.
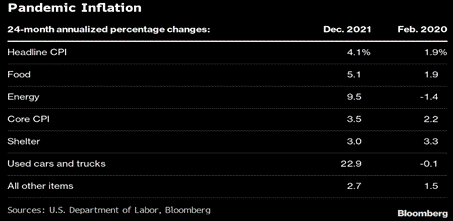
Figure 2 – Inflation Since the Start of the Pandemic (Bloomberg)
Sustained inflation and higher interest rates have the potential to be lethal to a standard portfolio of stocks and bonds. Inflation accelerated at the fastest pace in this last quarter of 2021 since the early 1980s. A lot is riding on the idea that the Fed really can do what it says: cool down the economy without tanking it. Inflationary fears tend to drive up the yield on 10-year bonds, which is usually detrimental to growth stocks. Another trend also emerges during inflationary times; companies can raise prices to boost profit margins.
Value-based companies are mature, long-standing companies, and they can use their earnings to improve their margins. Growth companies rely on expected earnings and lack a long-standing performance track record. An environment with higher sustained inflation would warrant a tilt towards value stocks over growth stocks.
Supply Chain Issues
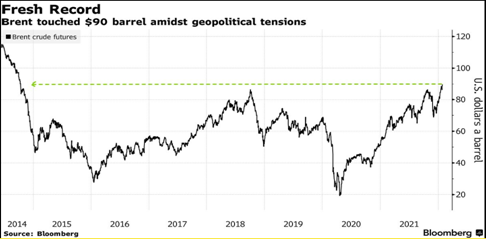
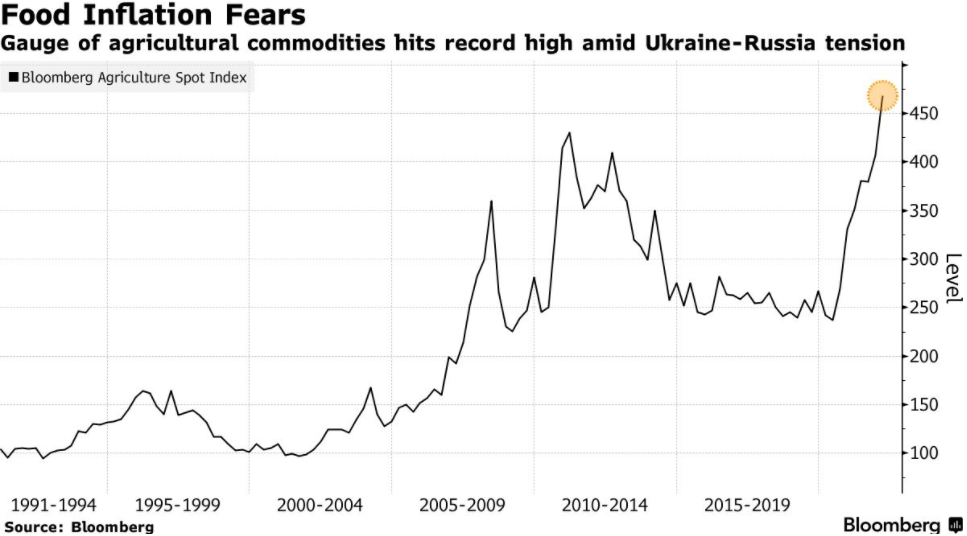
Whether its semiconductor chip shortages, Russia-Ukraine tensions causing oil prices to surge to over $90 or the availability of food & other consumer staples – supply chain woes are far from over. Supply chains are still grappling with high costs of energy, packaging, and transportation, as well as shortages of workers and shipping containers. Grain prices have jumped since mid-2020 as bad weather curbed harvests, China scooped up supplies, and a fertilizer crunch added to farmers’ costs. Other key foods have also seen significant price increases in 2021 (chart below). These supply chain issues will most likely continue to impact our lives for the rest of 2022 and possibly have some prolonged effects.
From an investment standpoint, these supply chain issues do not provide a clear position opportunity, as some of the increased costs/delays are passed onto consumers while others impact companies directly. In general, these effects would be expected to create more volatility in sectors with greater reliance on international shipping, like energy, consumer goods, materials, and industrials.
Geopolitical Risk
With Russia’s invasion of Ukraine, investors should maintain a defensive bias and seek haven in quality investments. While most strategists & geopolitical experts expect the impact of a potential conflict to be brief, volatility is expected in the near term (which has been very evident in the market over the past few weeks).
Keeping these geopolitical risks in mind, sectors like energy and financials, value stocks, and commodities are positioned to benefit from robust economic growth and are relatively well insulated from the primary market risks. The quality & resilience of companies is of vital importance during such challenging times.
Current Stock Valuations
The Price You Buy At Affects Your Returns
When making investments, nobody is buying with an expectation to lose money. With any purchase, the price you pay is your current perception of fair value. It includes your expectations for any future value you will receive from your purchase.
However, the stock market does not always go up in value, even though everyone buys with an expectation of a positive return. As new information becomes available and new events unfold, our expectations change. This may move prices up or down, but rarely do they stay for long on the expected path we imagined when buying.
These expectations that we start with are a large part of the stock market’s valuation. Knowing how lofty our expectations are at a given moment is not useful for forecasting short-term returns, but it can be a useful indicator for long-term returns. In fact, there is a formula in finance for this purpose: the CAPE Ratio2 (Cyclically-Adjusted-Price-to-Earnings Ratio), also known as the Shiller P/E.
CAPE Ratio
A high CAPE ratio (the current price is relatively high compared to the amount of historical earnings) indicates the market is overvalued and future long-term returns will be poor. A low CAPE ratio indicates the market is undervalued and future long-term returns will be strong.
A further look into historical CAPE ratios is included at the bottom of this post if you really like numbers. For brevity, using this valuation tool we will consider the following ranges of CAPE ratios as follows:
- Below 10: Very Cheap
- Between 10-20: Moderately Cheap
- Between 20-30: Moderately Expensive
- Above 30: Very Expensive
To be clear, the CAPE ratio is not useful as a market timing tool. Even if valuations are near all-time highs, selling out of the stock market entirely will almost always result in a lower return in the long-term versus staying invested. This ratio is meant only as a long-term point of reference, which is useful for setting expectations for long-term investing and financial planning.
Where are CAPE Ratios Today?
CAPE ratios for the global stock market are at very high levels relative to historical periods. The yellow dots in the following chart are the highest CAPE ratios recorded for the global stock market, and they are from the tech boom in the late-1990s to 2001. The shaded range is the range of CAPE ratios experienced over the past 5 years, which are no less extreme.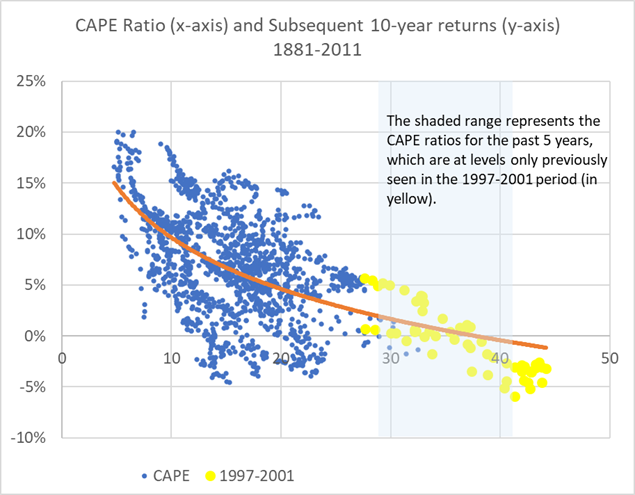
In using the labels above, the global stock market is Very Expensive, and has been for some time. This could continue for another long period of time, but the odds of having very strong stock returns over the next ten years from current valuations is low.
The Global Stock Market is Multiple Markets…
Not all parts of the stock market are at such high valuations. There are many ways to divide the stock market for relative analysis.
One way is to look at Growth versus Value stocks. Using indices for the broader US market, we can see the following CAPE ratios on December 31, 2021:
- Russell 1000 Growth Index: 4 (Very Expensive)
- Russell 1000 Value Index: 8 (Moderately Expensive)
Another way is by region. Here are some country-specific index valuations on December 31, 2021:
- Canada: 9 (Moderately Expensive)
- USA: 0 (Very Expensive)
- United Kingdom: 5 (Moderately Cheap)
- Europe: 3 (Moderately Expensive)
And a third way is by sector. Here are some sector-specific index valuations on December 31, 2021, using companies listed in the S&P 500 Index:
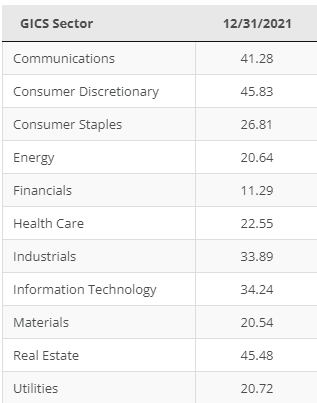
- Very Expensive Sectors:
- Communications, Consumer Discretionary, Industrials, Technology, Real Estate
- Moderately Expensive Sectors:
- Consumer Staples, Energy, Health Care, Materials, Utilities
- Moderately Cheap Sectors:
- Financials
…But The Global Stock Market Is All Connected
We can see above that most markets we look at here are either Very Expensive or Moderately Expensive. Stocks in general have had many factors in their favour in the last few years as we noted above. However, there are pockets of the stock market that have much higher valuations than others. These would typically be areas like US Growth and specifically Technology stocks that are starting to have a variety of headwinds develop.
High-valuation areas of the stock market do not warrant selling or avoiding those areas of the market entirely. They can still out-perform or have specific opportunities that can add value to your portfolio. In our long-term positioning, we favour tilting towards value over growth and tilting away from the US stock market in favor of other global markets.
Summary
At Alitis, extreme valuations in the stock market only further bolster our enthusiasm to use alternative investments and appropriate diversification to provide our clients with solid returns on their investments.
To repeat a point made above, these valuations do not provide a market timing tool. The perfect time for you to invest in anything is more dependent on your personal planning, financial goals, risk tolerance and time horizon than it is on market levels. We believe a diversified approach to investing provides better risk-adjusted returns over the long-term, which is the most important horizon to us as long-term investors.
We hope you enjoyed reading this and will look forward to the next article in our series, where we will highlight the features and benefits of the Alitis Dividend Growth Pool. We will leave you with this thought from The Intelligent Investor: The Definitive Book on Value Investing:
“The lesson is clear: Don’t just do something, stand there. It’s time for everyone to acknowledge that the term “long-term investor” is redundant. A long-term investor is the only kind of investor there is. Someone who can’t hold on to stocks for more than a few months at a time is doomed to end up not as a victor but as a victim.”
– Benjamin Graham, Author
Sincerely,
Apurva Parashar, MBA, CAIA, CIM®
Associate Portfolio Manager
Alitis Investment Counsel Inc.
Thomas Nowak, CFA
Portfolio Manager
Alitis Investment Counsel Inc.
Appendix
The CAPE Ratio is used on indexes and takes the current index price divided by the past 10 years of earnings data adjusted for inflation. For more details on the calculation, see https://www.forbes.com/advisor/investing/shiller-pe-ratio/
A high CAPE ratio (the current price is relatively high compared to the amount of historical earnings) indicates the market is overvalued and future long-term returns will be poor. A low CAPE ratio indicates the market is undervalued and future long-term returns will be strong.
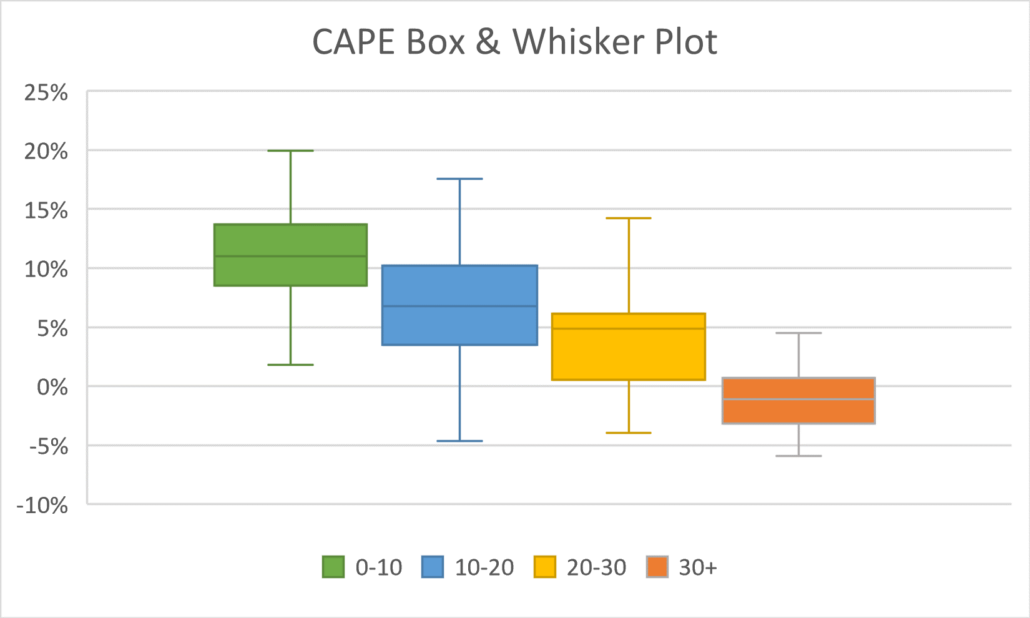
Using U.S. stock price data going all the way back to 1881, it can be shown that there is a clear relationship between lower 10-year returns and higher starting CAPE ratios3. For periods with starting CAPE ratios below 10, the average 10-year subsequent annual return is 11.3%, whereas starting CAPE ratios over 30 have had an average 10-year subsequent annual return of -1.0%.
The chart with the boxes shows the range of historical outcomes graphically. The top and bottom “T” lines are the maximum and minimum return for those ranges of CAPE ratios, the top and bottom of the shaded box for each range represent the 25th and 75th percentiles, and the horizontal line in the middle of each box represents the 50th percentile (median).
| Initial CAPE Ratio | Percentage of time in range | Subsequent 10-year annualized real returns | ||
| Average (Mean) | Minimum | Maximum | ||
| Less than 10 | 15% | 11.3% | 1.8% | 20.0% |
| 10 to 20 | 62% | 6.8% | -4.6% | 17.6% |
| 20 to 30 | 20% | 4.0% | -4.0% | 14.2% |
| Greater than 30 | 4% | -1.0% | -5.9% | 4.5% |
With this data on hand, by this valuation tool we can label these four ranges as follows:
- Below 10: Very Cheap
- Between 10-20: Moderately Cheap
- Between 20-30: Moderately Expensive
- Above 30: Very Expensive
Disclaimers and Disclosures
- Vishnoi, Abhishek. “Cheap Stocks to Finally Have Their Day in 2022, Investors Say.” Bloomberg, 3 Jan. 2022, www.bloomberg.com/news/articles/2022-01-03/cheap-stocks-to-finally-have-their-day-in-2022-investors-say?sref=4ZAyTULR.
- Mathews, Steve. “A Guide to the Fed Meeting as It Seeks to Tame Inflation.” Bloomberg, 26 Jan. 2022, www.bloomberg.com/news/articles/2022-01-26/fed-to-signal-march-interest-rate-liftoff-decision-day-guide?sref=4ZAyTULR.
- Durisin, Megan. “Don’t Bank on Food Getting Cheaper Quickly If Crop Prices Ease.” Bloomberg, 28 Jan. 2022, www.bloomberg.com/news/newsletters/2022-01-28/supply-chain-latest-expensive-food-even-if-crop-prices-ease?sref=4ZAyTULR.
- Brush, Michael. “Four Reasons Why Value Stocks Are Poised to Outperform Growth in 2022 — and 14 Stocks to Consider.” MarketWatch, 15 Jan. 2022, www.marketwatch.com/story/four-reasons-why-value-stocks-are-poised-to-outperform-growth-in-2022-and-14-stocks-to-consider-11641991663.
- Jackson, Anna-Louise, and John Schmidt. “2021 Stock Market Year In Review.” Forbes, 3 Jan. 2022, www.forbes.com/advisor/investing/stock-market-year-in-review-2021.
- Chrysoloras, Nikos. “The Stock Investor’s Playbook for the New World of Rising Interest Rates.” Bloomberg, 14 Feb. 2022, www.bloomberg.com/news/articles/2022-02-14/a-stock-investor-s-playbook-for-the-new-world-of-rising-rates?sref=4ZAyTULR.
- https://indices.barclays/IM/21/en/indices/static/historic-cape.app
- http://www.econ.yale.edu/~shiller/data.htm
- https://siblisresearch.com/data/growth-value-pe-cape/
- https://siblisresearch.com/data/cape-ratios-by-sector/
- https://www.brandes.com/docs/default-source/brandes-institute/2018/the-cape-ratio-and-future-returns-a-note-on-market-timing.pdf
